
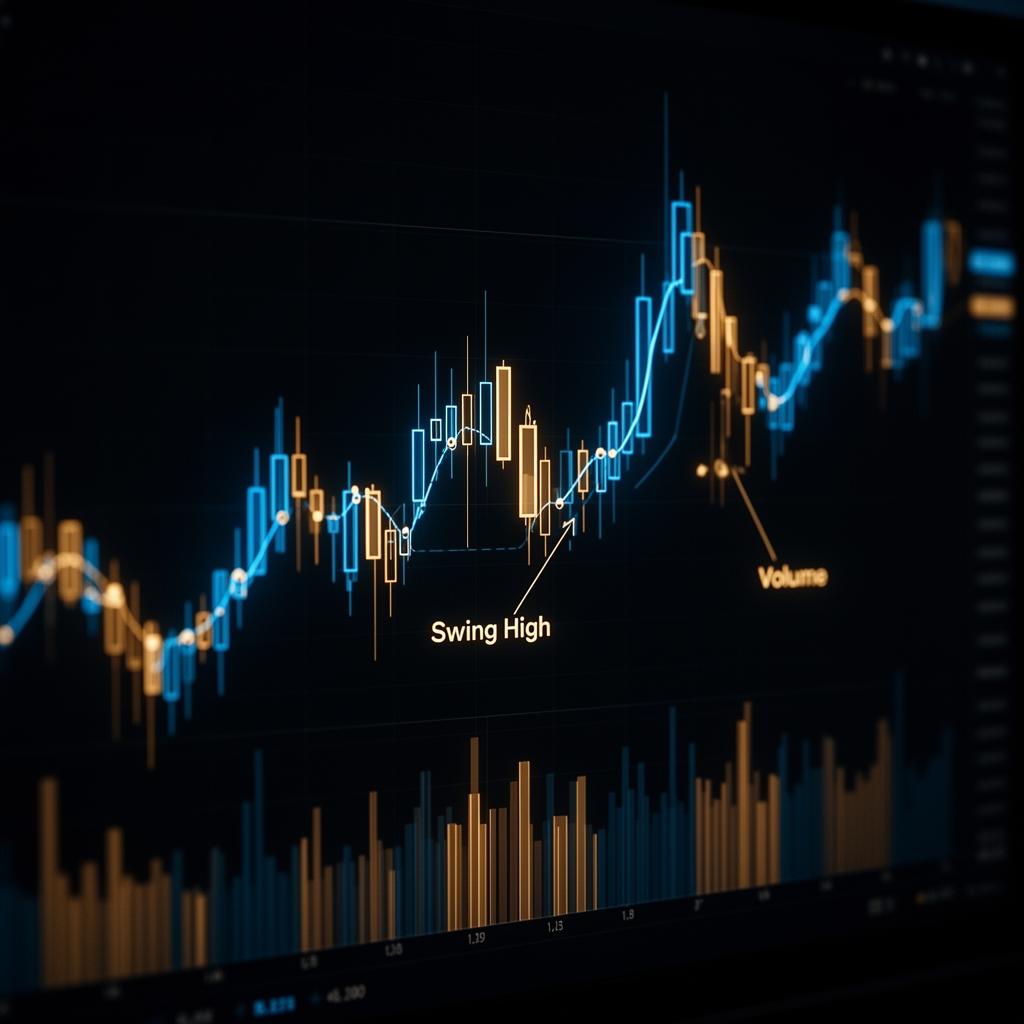
Most traders open a chart and see only red and green candles. A professional trader sees something different.
They see pressure. They see fear. They see confidence. They see hesitation. They see the psychology of buyers and sellers fighting for control.
Charts are not just lines moving up and down. They are the visible result of market behaviour.
Every candle tells a story. Every wick shows rejection. Every strong close shows conviction. Every pause shows uncertainty.
If you want to become a better trader, you must stop asking, "Where will price go next?" and start asking, "What is the market showing me right now?"
1. The chart is a story, not a prediction machine
Many beginners use charts to guess the future. This is dangerous. A chart does not guarantee what will happen next. It shows what is happening now. That present behaviour helps you make better decisions.
The goal is not to predict perfectly. The goal is to read the evidence clearly.
Trend direction
Are we trending up, down, or ranging? The market’s main direction reveals who holds control.
Candle size & closes
Strong bodies show conviction. Small bodies show hesitation. The close matters more than the high.
Support & resistance
Key zones where buyers defended and sellers rejected. Not lines — emotional boundaries.
Volume
The truth meter. Strong volume validates moves. Weak volume warns of false breakouts.
2. Trend shows market intention
The first thing every trader should read is the trend. If price is making higher highs and higher lows, buyers are in control. If price is making lower lows and lower highs, sellers are in control.
A trend does not tell you how far the market will move. It tells you where the pressure is.
Most losing traders fight the trend because they want to catch reversals. Professional traders respect the trend because they understand momentum. The trend is the market’s main direction. Trade with it, not against it.
3. Market structure is the skeleton of price
Market structure is how price builds its movement. It shows:
- Where buyers entered and held
- Where sellers defended and rejected
- Where price reversed with conviction
- Where momentum changed direction
- Where liquidity may be resting
Swing highs and swing lows are key. A swing high can show where buyers lost strength. A swing low can show where sellers lost control. Once you understand structure, you stop seeing random candles. You begin seeing the map of the market.
4. Support and resistance are zones, not lines
Many beginners draw one thin line and expect the market to respect it perfectly. That is not how trading works.
Support and resistance are better understood as zones. A support zone is an area where buyers may defend price. A resistance zone is an area where sellers may step in.
These zones are emotional boundaries. They are places where traders remember previous reactions. Big players may defend these areas. Retail traders often get trapped around them. The strongest setups often happen when price reaches a key zone and candles start showing rejection, weakness, or confirmation.
5. Candles are the language of the market
Every candle speaks.
- A strong body shows conviction
- A small body shows hesitation
- A long upper wick shows selling pressure
- A long lower wick shows buying defence
The candle itself is not enough. Context matters. A bullish candle in the middle of nowhere means little. A bullish candle at support with strong volume means much more. This is where traders improve. They stop reacting to candles emotionally and start reading them logically.
Ask yourself: Where did this candle form? Did it close strongly? Did it reject a level? Is it supported by volume? Is it aligned with the trend? That is real chart reading.
6. Wicks reveal the hidden battle
Wicks are one of the most important parts of a candle. They show where price tried to go but failed. A long upper wick near resistance may suggest sellers rejected higher prices. A long lower wick near support may suggest buyers defended the area.
This does not mean you enter immediately. It means you pay attention. Wicks show struggle. They show where the market tested a level and failed to continue. That can become valuable information.
7. Speed shows market energy
The speed of price movement matters. Fast moves with strong candles can show confidence. Slow moves with weak candles can show uncertainty. But speed alone is not enough.
Fast moves can also trap traders, especially if they happen without volume or after price has already stretched too far. A professional trader does not chase every fast candle. They ask: "Is this real strength, or is this emotional movement?" That question can save your account.
8. Volume confirms the truth
Volume is like the market’s truth meter. If price breaks a level with strong volume, the move may have real support behind it. If price breaks a level with weak volume, the move may be false.
Many traders get trapped in false breakouts because they look only at price. Professional traders look for confirmation. A breakout without volume is often weak. A move with volume has more weight. Volume helps you separate real momentum from fake excitement.
9. Fake breakouts trap emotional traders
One of the most common traps in trading is the false breakout. Price breaks above resistance or below support. Beginners rush in. Then price quickly reverses.
Why does this happen? Because the breakout did not have real strength behind it. A fake breakout often shows:
- Weak volume behind the move
- Long rejection wicks on the breakout candle
- No follow-through after the break
- Sudden reversal within one or two candles
- Emotional, news-driven candles
The best traders are not desperate to enter every breakout. They wait for confirmation. Sometimes the best trade is the one you do not take.
10. Patterns are emotions, not just shapes
Many traders memorise patterns. Head and shoulders. Double bottom. Triangles. Flags. Breakouts. But knowing the name of a pattern is not enough. You must understand the emotion behind it.
A double bottom is not just a shape. It may show sellers failing twice and buyers gaining confidence. A head and shoulders is not just a formation. It may show buyers losing strength while sellers prepare to take control. Patterns become powerful when you understand the psychology behind them.
11. The market has three main states
At any time, the market is usually doing one of three things:
- Trending — price moves with clear direction
- Ranging — price moves sideways between zones
- Preparing for a breakout — candles compress and volatility reduces
Most traders lose because they use the wrong strategy in the wrong market condition. You cannot trade a ranging market like a trending market. First understand the condition. Then choose the setup.
12. Patience is part of chart reading
Good chart reading is not just knowing when to enter. It is also knowing when to stay out.
- No clear structure? Stay out.
- No confirmation? Stay out.
- No volume? Stay out.
- Too much uncertainty? Stay out.
This is difficult because traders want action. But trading is not about being busy. It is about being accurate and disciplined. A professional trader understands that protecting capital is also a winning decision.
13. The chart becomes clear when your mind is quiet
Charts can look confusing when your mind is full of fear, greed, and impatience. You may see what you want to see, not what is really there. That is why psychology matters.
A calm trader reads better. An emotional trader reacts faster. There is a big difference. If you want to read charts properly, you must train your mind to slow down.
Do not chase. Do not force. Do not predict. Observe. The chart will tell you enough if you are patient enough to listen.
Final thoughts
Chart reading is not magic. It is the skill of understanding price behaviour, market structure, candle psychology, volume, and context. A beginner sees candles. A professional sees the story behind the candles.
To improve your chart reading, focus on:
- Trend — know the market’s main direction
- Structure — read the map of swing highs and lows
- Key zones — support and resistance as emotional boundaries
- Candle behaviour — bodies, wicks, closes, and context
- Wick rejection — where price tried to go but failed
- Volume confirmation — separating real moves from fake ones
- Market speed — energy vs emotional stretching
- Patience — the best setups are worth waiting for
- Risk management — protecting capital is a winning decision
The goal is not to win every trade. The goal is to make better decisions, protect capital, and trade with discipline.
A beginner sees candles. A professional sees the story behind them.
Trade Smart. Read the Chart. Grow Consistently.
About NestPro Trade
At NestProTrade, we believe successful trading starts with discipline, risk management, and consistency. Whether you're interested in copy trading, market analysis, or improving your trading psychology, our mission is simple: Trade Smart. Grow Consistently.
Disclaimer: Trading involves risk. This article is for educational purposes only and does not provide financial advice. Always trade responsibly and never risk money you cannot afford to lose.